Alright, you learned about ActiveSupport::Notifications, InfluxDB, Grafana and influxdb-rails
in the two previous posts. Let's dive a bit deeper and look how we built the dashboards for you. So we can
study, change and improve them together.
“Individually we are one drop; but together we are an ocean.” – Ryunosoke Satoro
Welcome to your Ruby on Rails Application Monitoring 101.
- ActiveSupport::Notifications is rad! 💘
- Measure twice, cut once: App Performance Monitoring with influxdb-rails
- Let's build Software Libre APM together (this post)
The Ying and Yang of measurements
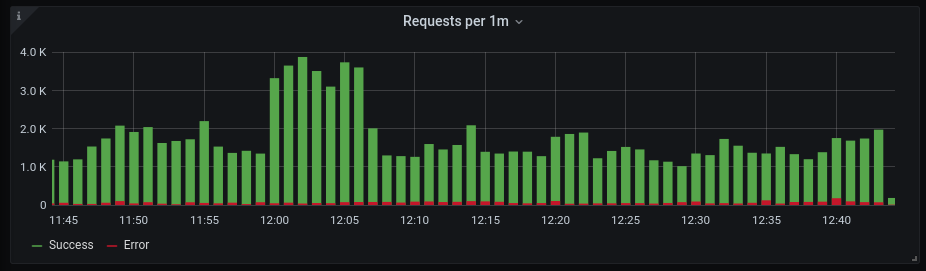
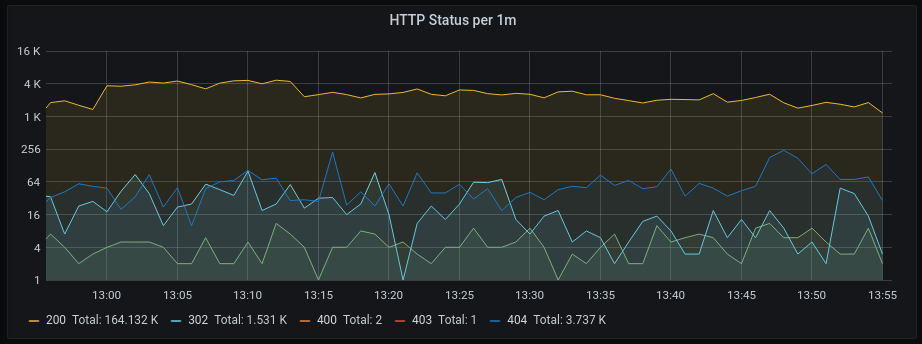
Basically there are two types of measurements we do. How often something happened and how long something took. Both types are most often complementary, interconnected and interdependent. On the performance dashboard we count for instance how many requests your application is serving.
We also look at the time your application spends on doing that.
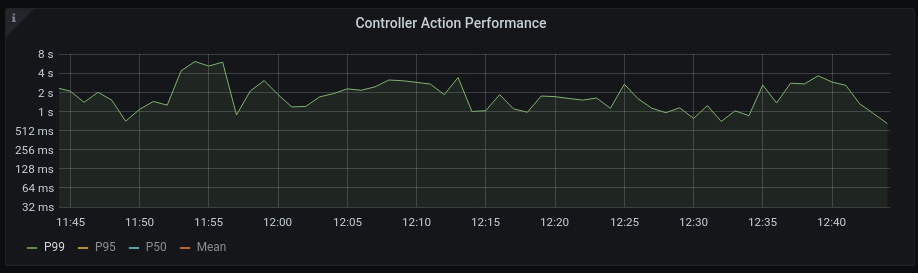
At some point the number of requests will have an influence on the time spend (oversaturation). If one of your actions is using too many resources it will have influence on the number of requests you are able to serve (overutilization). Ying and Yang.
The minions of measurements
Looking at the graphs above you see some helpers at work you should know about.
Time
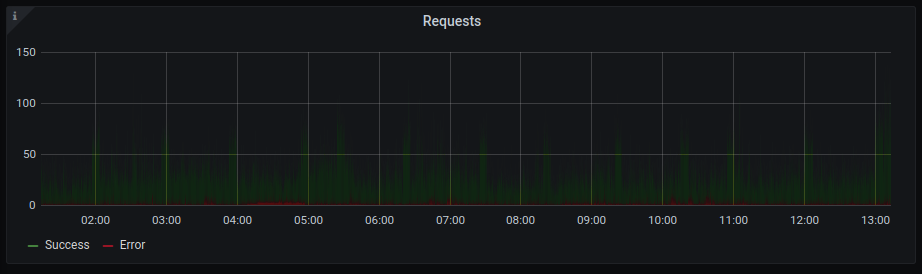
First and foremost: Time Windows. The requests are counted per minute and we look at measurements in the last hour. Time windows help to lower information density and make your measurements a bit more digestible. Look at the same measurements per second for the last 12 hours. 60 times 24 higher information density. Not so easy to interpret anymore...
Statistics
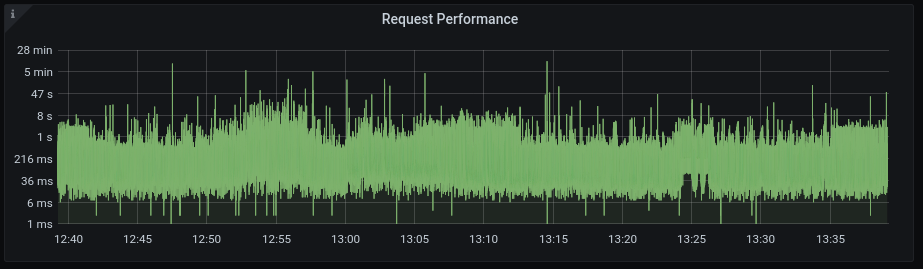
The same way time windows will make it easier for you to understand your data, some descriptive statistics will help you too. For instance calculating the maximum time 99% of requests in the last minute took. Like we did above. I won't bore you to death with the math behind this, if you're into this checkout wikipedia or something. Just remember, it makes data digestible for you. Look at the same performance data without applying statistics.
Grouping
The third helper that makes data understandable for you is grouping data. Like ActiveJobs per minute grouped by queue. That grouping might make more clear to you why the number of jobs so high. Or grouping requests per minute by HTTP Status might reveal how much stuff goes wrong.
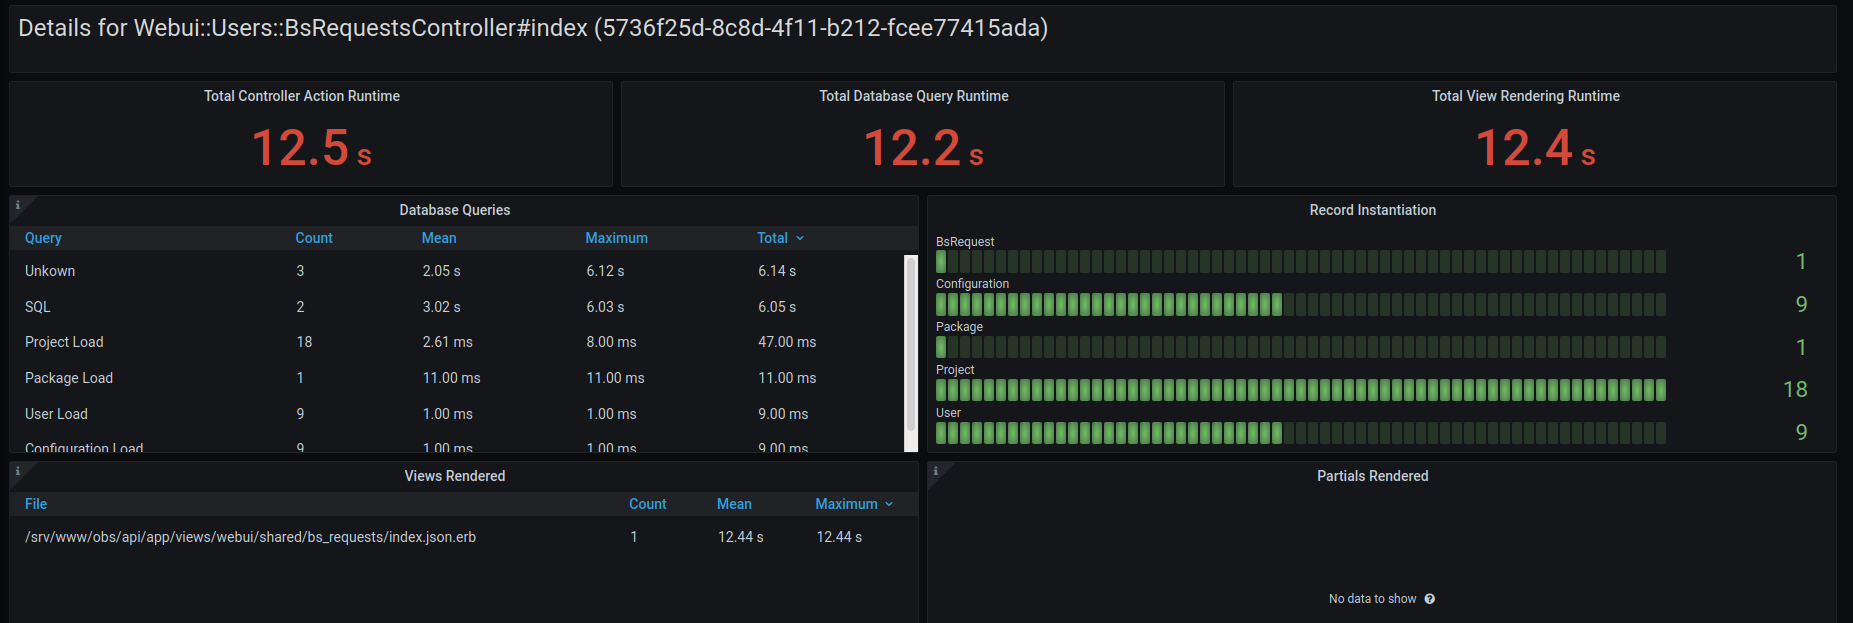
A different form of grouping is to visualize all measurements connected to a specific event, like a single request. Or all the measurements a specific controller action has fired in the last hour.
Rankings
Another thing we do on the dashboard is ranking (groups of) events by time, slow to fast. So you know where you might want to concentrate your efforts to improve performance.

Apply your knowledge, let's collaborate on Rails APM/AHM
Maybe I inspired some ideas for new features in the 101 above? I'm also sure there are many people out in the Rails community that have way more knowledge and ideas about statistics, measurements and all the tools involved than Chris and me. Let's work together, patches to the collection of dashboards (and the Ruby code) are more than welcome!
Why build, not buy?
But Henne, you say, there is already Sentry, New Relic, Datadog, Skylight and tons of other services that do this. Why build another one? Why reinvent the wheel?
Because Software Libre is an deeply evolutionary process. Software Libre, just like Evolution, experiments all the time. Many experiments find their niche to exist. Some even go global.

Coronavirus: BW CG Illustration by Yuri Samoilov
Like Linux, the largest install base of ALL operating systems on this planet. Wordpress powering an unbelievable 30% of the top 10 million websites. Mediawiki running the 5th most popular site globally. But also, more than 98% of all projects on GitHub are not seeing any development beyond the first year they were created. Just like 99% of all species that ever lived on Earth are estimated to be extinct.
We need to experiment and collaborate together. Evolution is what we do baby! 🤓 Can't run, copy, distribute, study, change and improve the software SaaS providers run. We can't scratch our itch, can't break it, learn how it works and make it better together, that's why. Let's do this!
Feedback?
Any criticism, remarks or praise about this post? Get in touch, I'm looking forward to your input!
